| | Home | Projects | Images | Miscellaneous | Contact | Sitemap |
| Home :: Projects :: MIRA :: Examples :: EST |
Different assembler have different assembly strategies and algorithms when it comes to work with EST data. This page makes a quick comparison between the PTA (Paracel Transcript Assembler) and MIRA, without rating the results as different strategies answer different questions.
The showcase project contains 19 EST sequences, all of them are of standard quality and had sequencing vectors marked before assembly.
The image below shows an overview of the results obtaines with PTA: 18 sequences were clustered into one mRNA transcript (sptest.0.C1), 1 sequence forms a singlet (sd002_029b_f01.q1ca).
 |
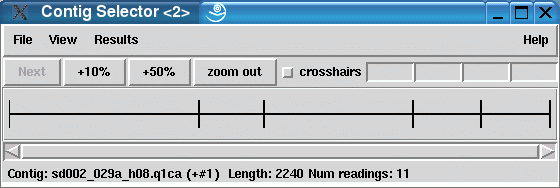
The result with MIRA looks a little bit different: there are 5 transcripts shown in the contig selector of the Staden package. 2 of them are contigs (with two or more sequences assembled together) and three of them are singlets.
 |
Investigating the differences
So, where do these differences come from and what do they mean? The following image is a screenshot of the PTA assembly viewer (transcriptview) of the main transcript with 18 sequences. Looking at positions 650 to 663 and at position 695, there are clearly "columns of mismatches" to be seen (the bases in red show a mismatch between the consensus base and the sequence base). Looking a bit closer, the bases matching and mismatching the consensus in these columns have a very good phred quality of 30 and more (the brighter the background, the better the base quality). Furthermore, the mismatch columns form a distinct sequence pattern, that is, always the same sequences are involved in those mismatches.
 |
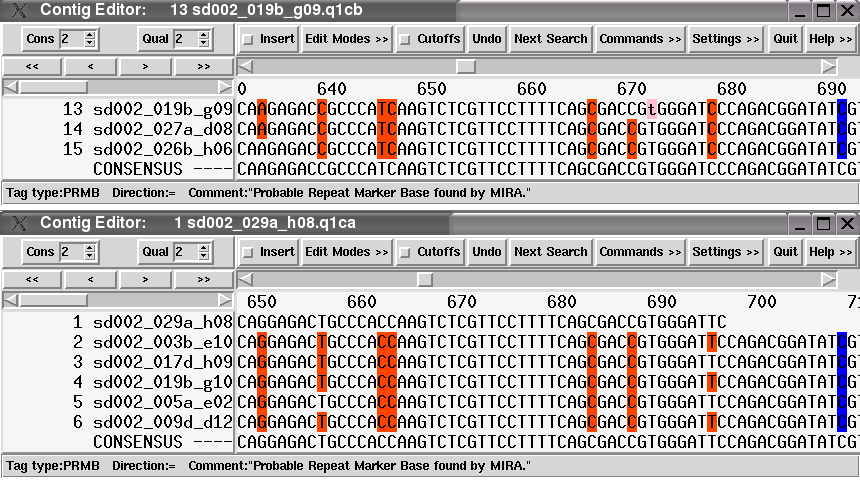
In contrast to this, MIRA put the reads into 5 different clean transcripts, without column mismatches. Those transcripts represent the real mRNA as it is produced in the cell. The image below shows the two clean transcript contigs that were assembled at approximately the same position than the contig shown in the PTA assembly viewer above.
The bases having a red background have been tagged by MIRA as Probable Repeat Marker Bases (PRMBs), which in case of ESTs represent SNPs. Note that columns having this tag differ between the two transcript contigs, but are consistent within the reads forming one transcript.
 |
Analysing and categorising the SNPs found
Optionally, once the clean transcripts have been built, MIRA can analyse their nature when doing intra- or interspecies experiments. The image below shows this last step of the EST assembly analysis, where the 5 clean transcripts assembled together. The two transcript contigs (named default_Contig1 and default_Contig2) are aligned with the 3 singlet transcripts (default_Singlet1 to ...3) and the assembler looks where SNPs occur in, e.g., different strains of an organism. The example below shows the case where tissue of two organisms (sponge1 and sponge2) produce similar mRNAs that contain different SNP categories: intra- and interorganism SNPs (shown with a light-green background) occur both within an organism or tissue as well as between different organisms and tissues. Interorganism SNPs (shown in turquoise) are SNPs that occur between transcripts of different organisms / tissues.
 |
All these analyses are performed automatically by the MIRA assembler and the results can be directly imported and displayed in the Staden package.